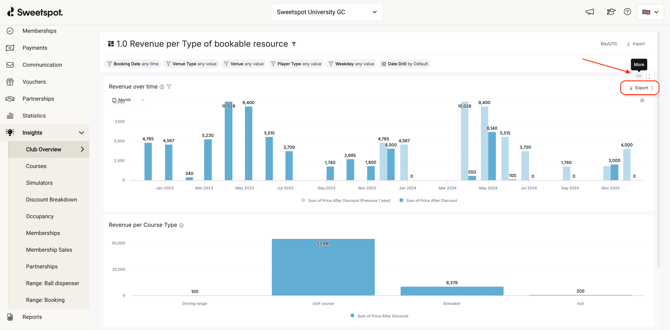
We are now releasing our new statistics view called "Insights". There will be a new menu item as shown in the picture below. We will step-by-step release new dashboards and give you access to more and more data.

Insights currently include the following dashboards:
| Club Overview | Overview of revenue and occupancy per type of bookable resource (Simulators, Driving Range, Golf Courses) |
| Golf Courses | Adapted KPIs for Golf Courses, e.g. number of rounds |
|
Simulators |
Adapted KPIs for Simulators, e.g. booked hours |
| Discount Breakdown | See the discount generated from memberships, vouchers, campaigns, partnerships |
| Occupancy | Dynamic occupancy statistics, chose to see occupancy per course, for a specific weekday or only for tee times for certain hours |
| Memberships | How much do our members play in average? When do they play? Members per membership and more |
| Membership Sales | For customers selling memberships through Sweetspot, see sales amount, number of memberships sold etc |
| Partnerships | See players per partnership, what is the value of the tee times partnerships consume? And more |
|
Range: Ball dispenser |
Statistics related to your range dispenser. Note: this will only appear if it is integrated. |
|
Range: Booking |
Statistics related to your driving range bookings |
Please find the main Pros and instructions for how to enjoy such below:
Filters
The filters are smarter than in the old dashboards, you can for example write “this year” and it will filter accordingly.
Automatic period comparisons
In the new dashboards there are automatic comparisons vs the same period last year.
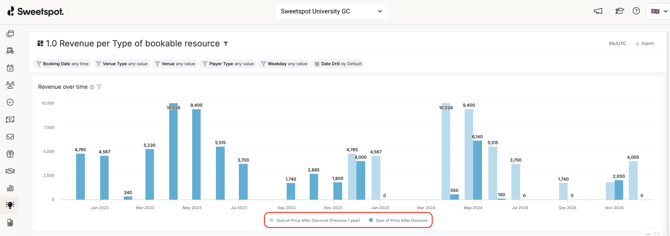
You can also change the granularity of the axis by changing the period in below marked “date drill”

Data drillthrough
Right-click on a data point to access another dashboard directly. For example, right click when holding the mouse over “Golf Course” and navigate to the dashboard “Golf Courses” to see the revenue per course.
In the “Golf Course” and “Simulator” dashboards you will access more adapted KPIs, for example Distribution of rounds between Guests, Members and Partners for Golf Courses and “Booked Hours” for simulators.
Please note that all the "Revenue" KPIs is based on Price after discount in all bookings. The KPI do not consider whether that price after discount is paid or not. It will also include Revenue for future bookings.
For billing purposes, which is based on actual transactions through Sweetspot (i.e. the payment is done in app or web portal) , we still refer to the old Statistics/Transactions
Role access
|
Transactions & Payouts |
Club Owner, Admin. |
| Club Overview | Club Owner, Admin, Course Operator (can only see data for the venues they have access to) |
| Golf Courses | Club Owner, Admin, Course Operator (can only see data for the venues they have access to) |
| Simulators | Club Owner, Admin, Course Operator (can only see data for the venues they have access to) |
|
Discount Breakdown |
Club Owner, Admin |
| Occupancy | Club Owner, Admin, Course Operator (can only see data for the venues they have access to) |
|
Memberships |
Club Owner, Admin |
|
Partnerships |
Club Owner, Admin |
|
Membership Sales |
Club Owner, Admin |